Dashboard Metrics
Your dashboard displays real-time metrics to help you make informed decisions about your venue operations.
Key Metrics Cards
Today's Summary
At-a-glance view of today's performance:
Reservations Today
- Total bookings for today
- Breakdown by status:
- Pending confirmation
- Confirmed awaiting guests
- Currently seated
- Completed
- Cancelled/No-shows
Capacity Utilization
- Percentage of tables filled
- Visual capacity gauge
- Available vs. booked slots
- Peak time indicators
Upcoming Arrivals
- Next 2 hours of expected guests
- Party sizes and times
- Special requests flagged
- Table assignment status
Weekly Overview
Week at a glance:
This Week's Performance
- Total reservations
- Comparison to last week
- Trend indicators (↑↓)
- Average party size
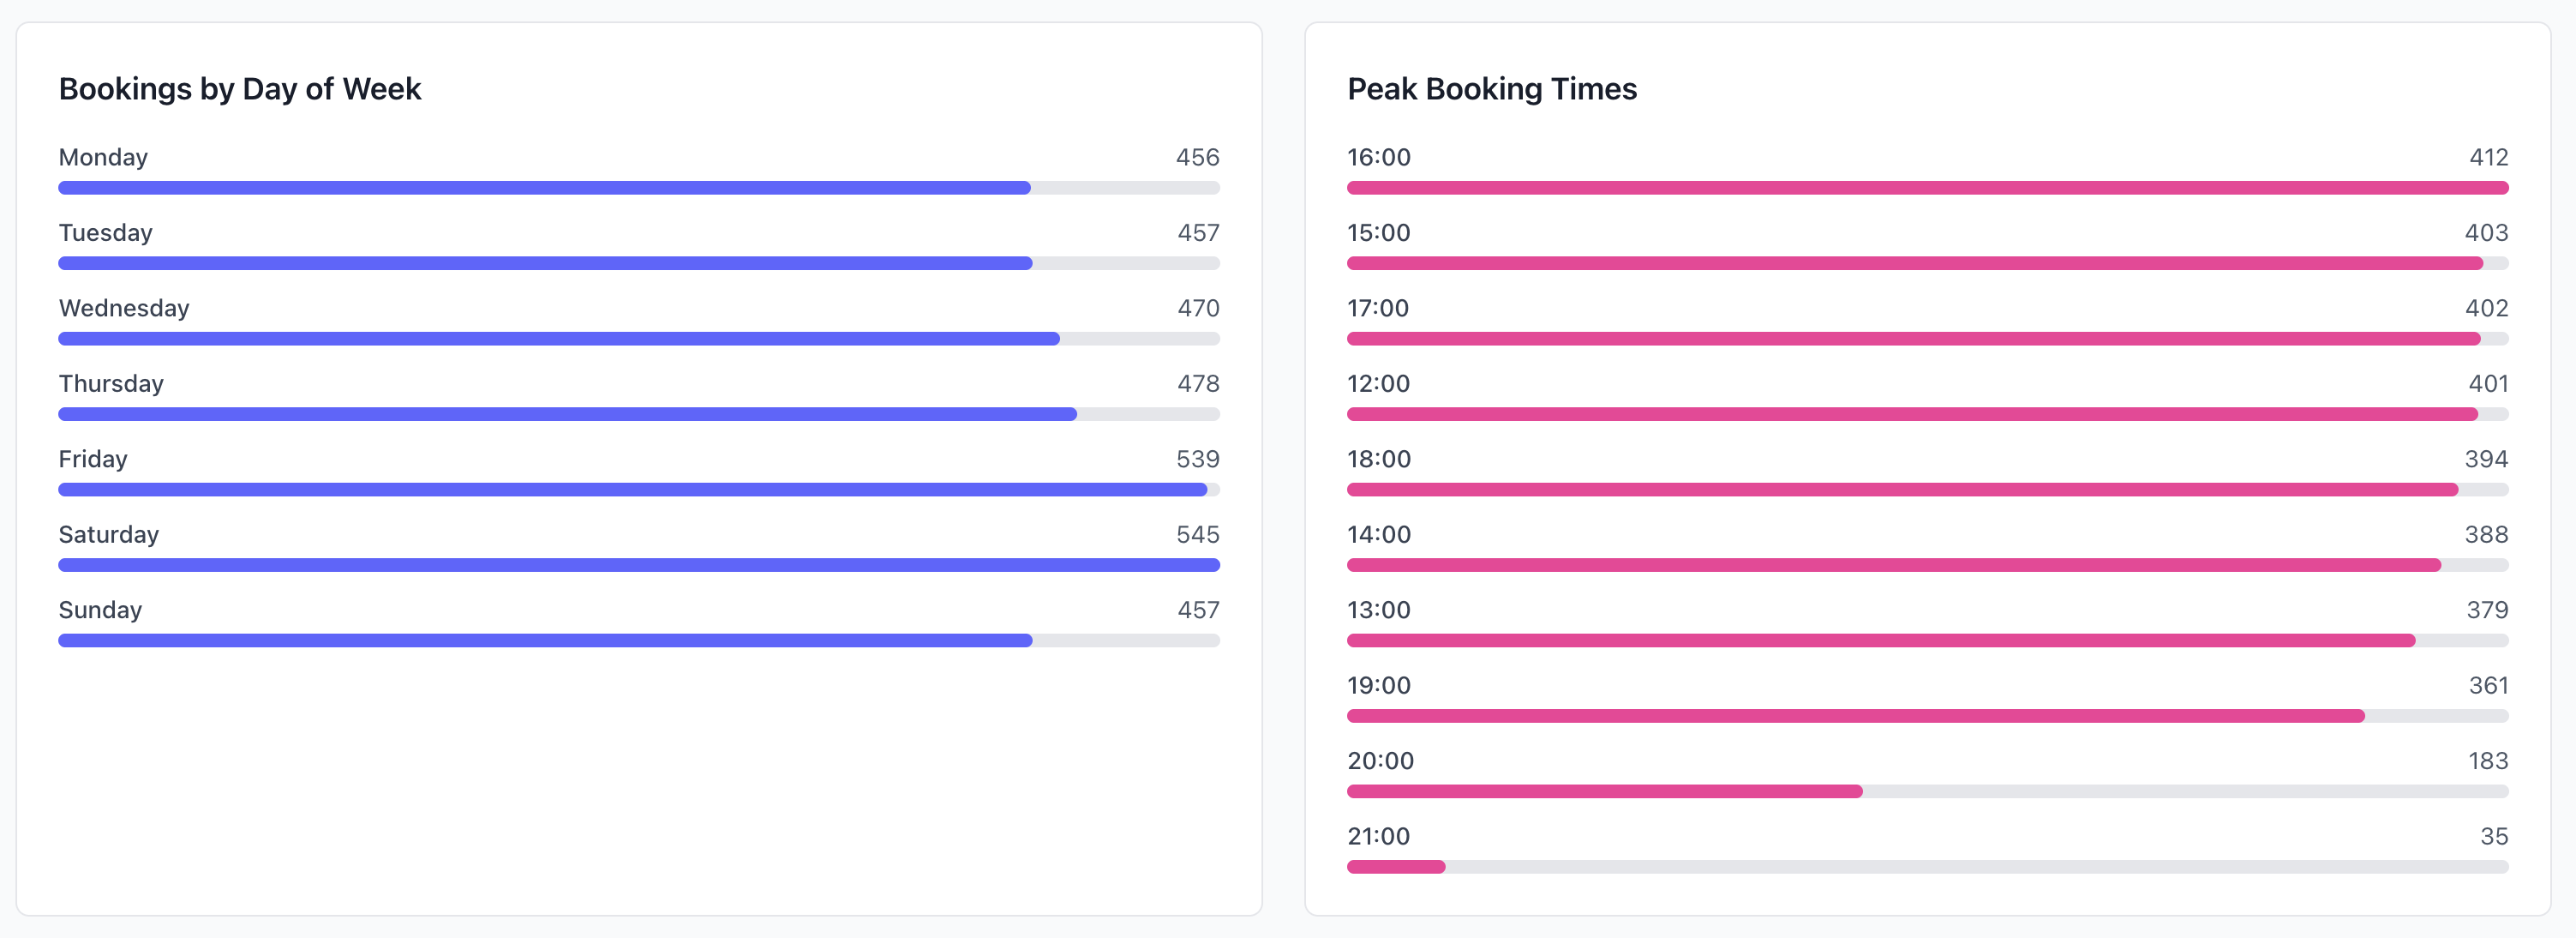
Popular Times
- Busiest days this week
- Peak dining times
- Utilization patterns
- Capacity trends
Revenue Metrics
Estimated Revenue
- Today's projected revenue
- Week-to-date total
- Month-to-date total
- Comparison to previous periods
Revenue estimates are based on your configured average spend per guest. Update this in Settings for accurate projections.
Average Spend
- Per guest (cover)
- Per reservation
- Trending up/down
- By day of week
Customer Satisfaction
Recent Reviews
- Average rating (this week)
- Total reviews
- New reviews (unread)
- Response rate
Trending Feedback
- Positive highlights
- Areas needing attention
- Common themes
- Action items
Staff & Operations
Today's Staff
- Who's working today
- Shift times
- Positions covered
- Total staff hours
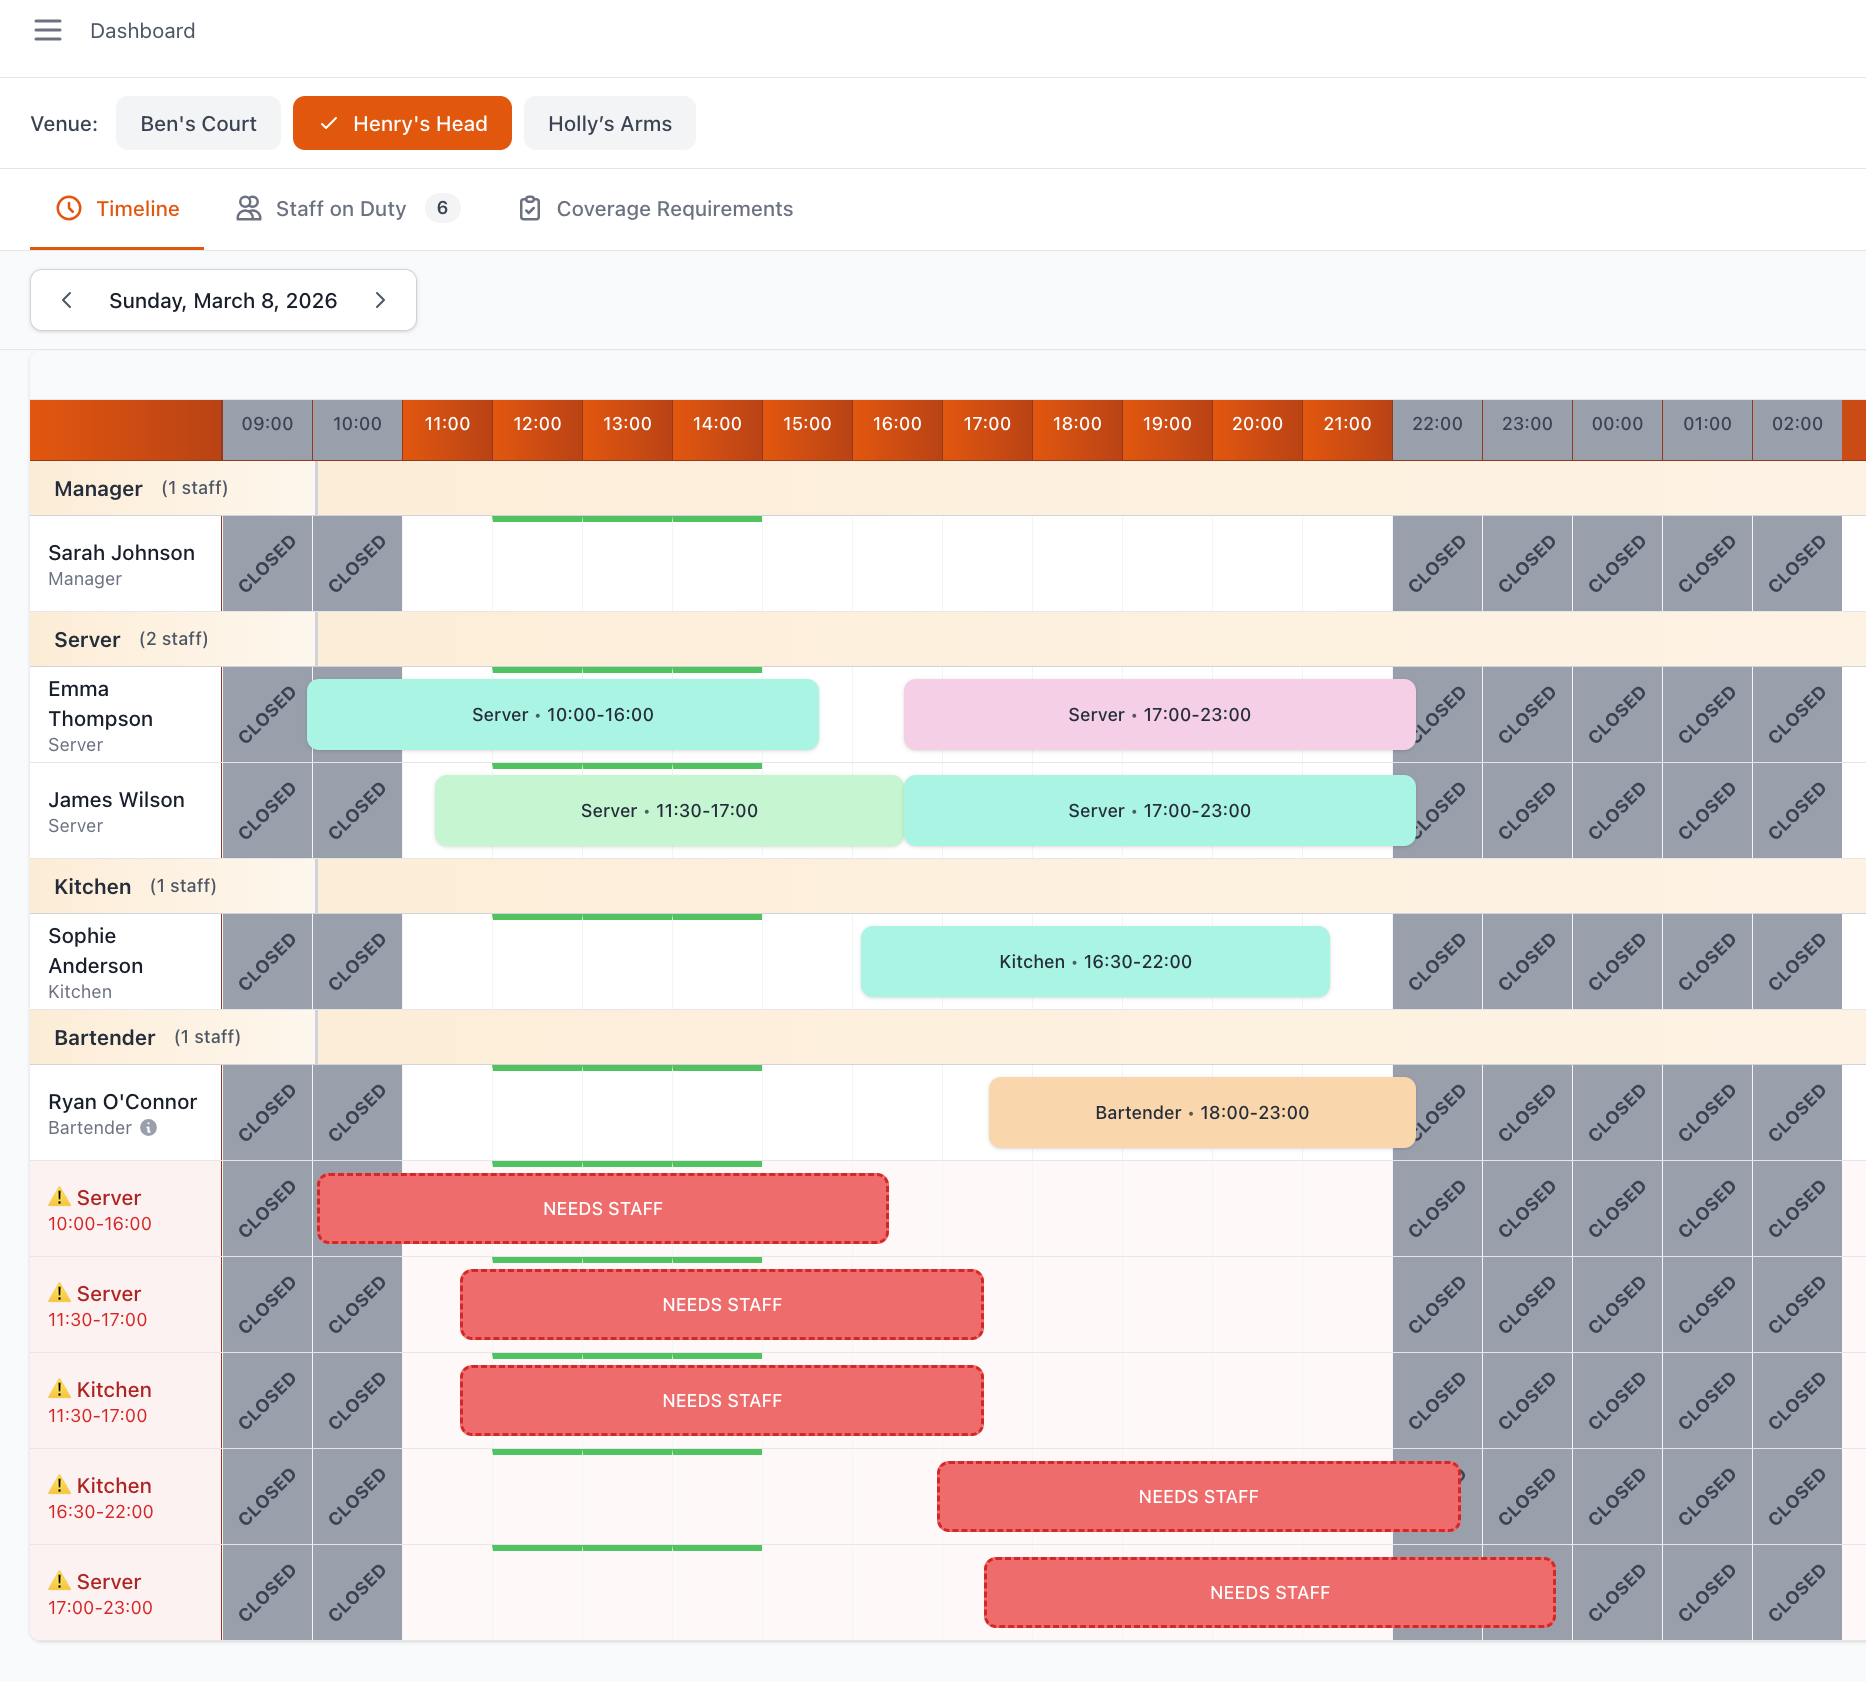
Operational Alerts
- Outstanding confirmations
- Unassigned tables
- Special requests needing attention
- System notifications
Performance Trends
Chart Visualizations
Reservation Trends
- Line chart: Bookings over time (30 days)
- Identify growth or decline
- Spot patterns and cycles
- Compare to goals
Capacity Utilization
- Bar chart: Daily capacity by time slot
- Identify peak and off-peak
- Optimize staffing
- Plan promotions
Table Turnover
- Average time guests stay
- Efficiency trends
- Target vs. actual
- By day of week
Insights & Recommendations
AI-Powered Insights
System analyzes your data and suggests:
Opportunities:
- "Thursday lunch underbooked - consider promotion"
- "Weekend breakfast showing 30% growth"
- "Outdoor seating high demand - extend hours?"
Warnings:
- "No-show rate up 15% this month"
- "Friday dinner bookings down vs. last month"
- "Multiple negative reviews mentioning wait times"
Action Items:
- Priority flagged (high/medium/low)
- One-click actions where possible
- Expected impact shown
- "Dismiss" or "Remind me later"
Seasonal Patterns
Identify patterns:
- Best performing days/times
- Seasonal trends
- Weather impact (if outdoor seating)
- Holiday booking patterns
Performance Monitoring
Key Metrics to Watch
Target Benchmarks:
- Utilization rate (target: 75-85%)
- No-show rate (target: <10%)
- Average rating (target: 4.5+)
- Response rate (target: 90%+)
- Confirmation time (target: <2 hours)
Troubleshooting Metrics
If Metrics Seem Wrong:
Verify:
- Correct venue selected
- Time zone settings correct
- Date range as expected
- No active filters
- Revenue settings configured
Related Documentation
- Dashboard Overview - Return to main dashboard guide
- Dashboard Activity & Alerts - Notifications and activity feed
- Dashboard Reports - Reporting and exports
- Analytics - Detailed performance analysis
Need Help?
Contact support:
- Email:
[email protected] - WhatsApp: https://wa.me/message/GPBDMIVKYIELE1