Appearance
Reports
Generate detailed analytics and business intelligence reports.
Overview
Reports provide comprehensive analytics on bookings, revenue, customers, and operations. Generate standard reports or create custom reports to gain insights and make data-driven decisions.
Accessing Reports
Navigate to Venue Operations > Reports
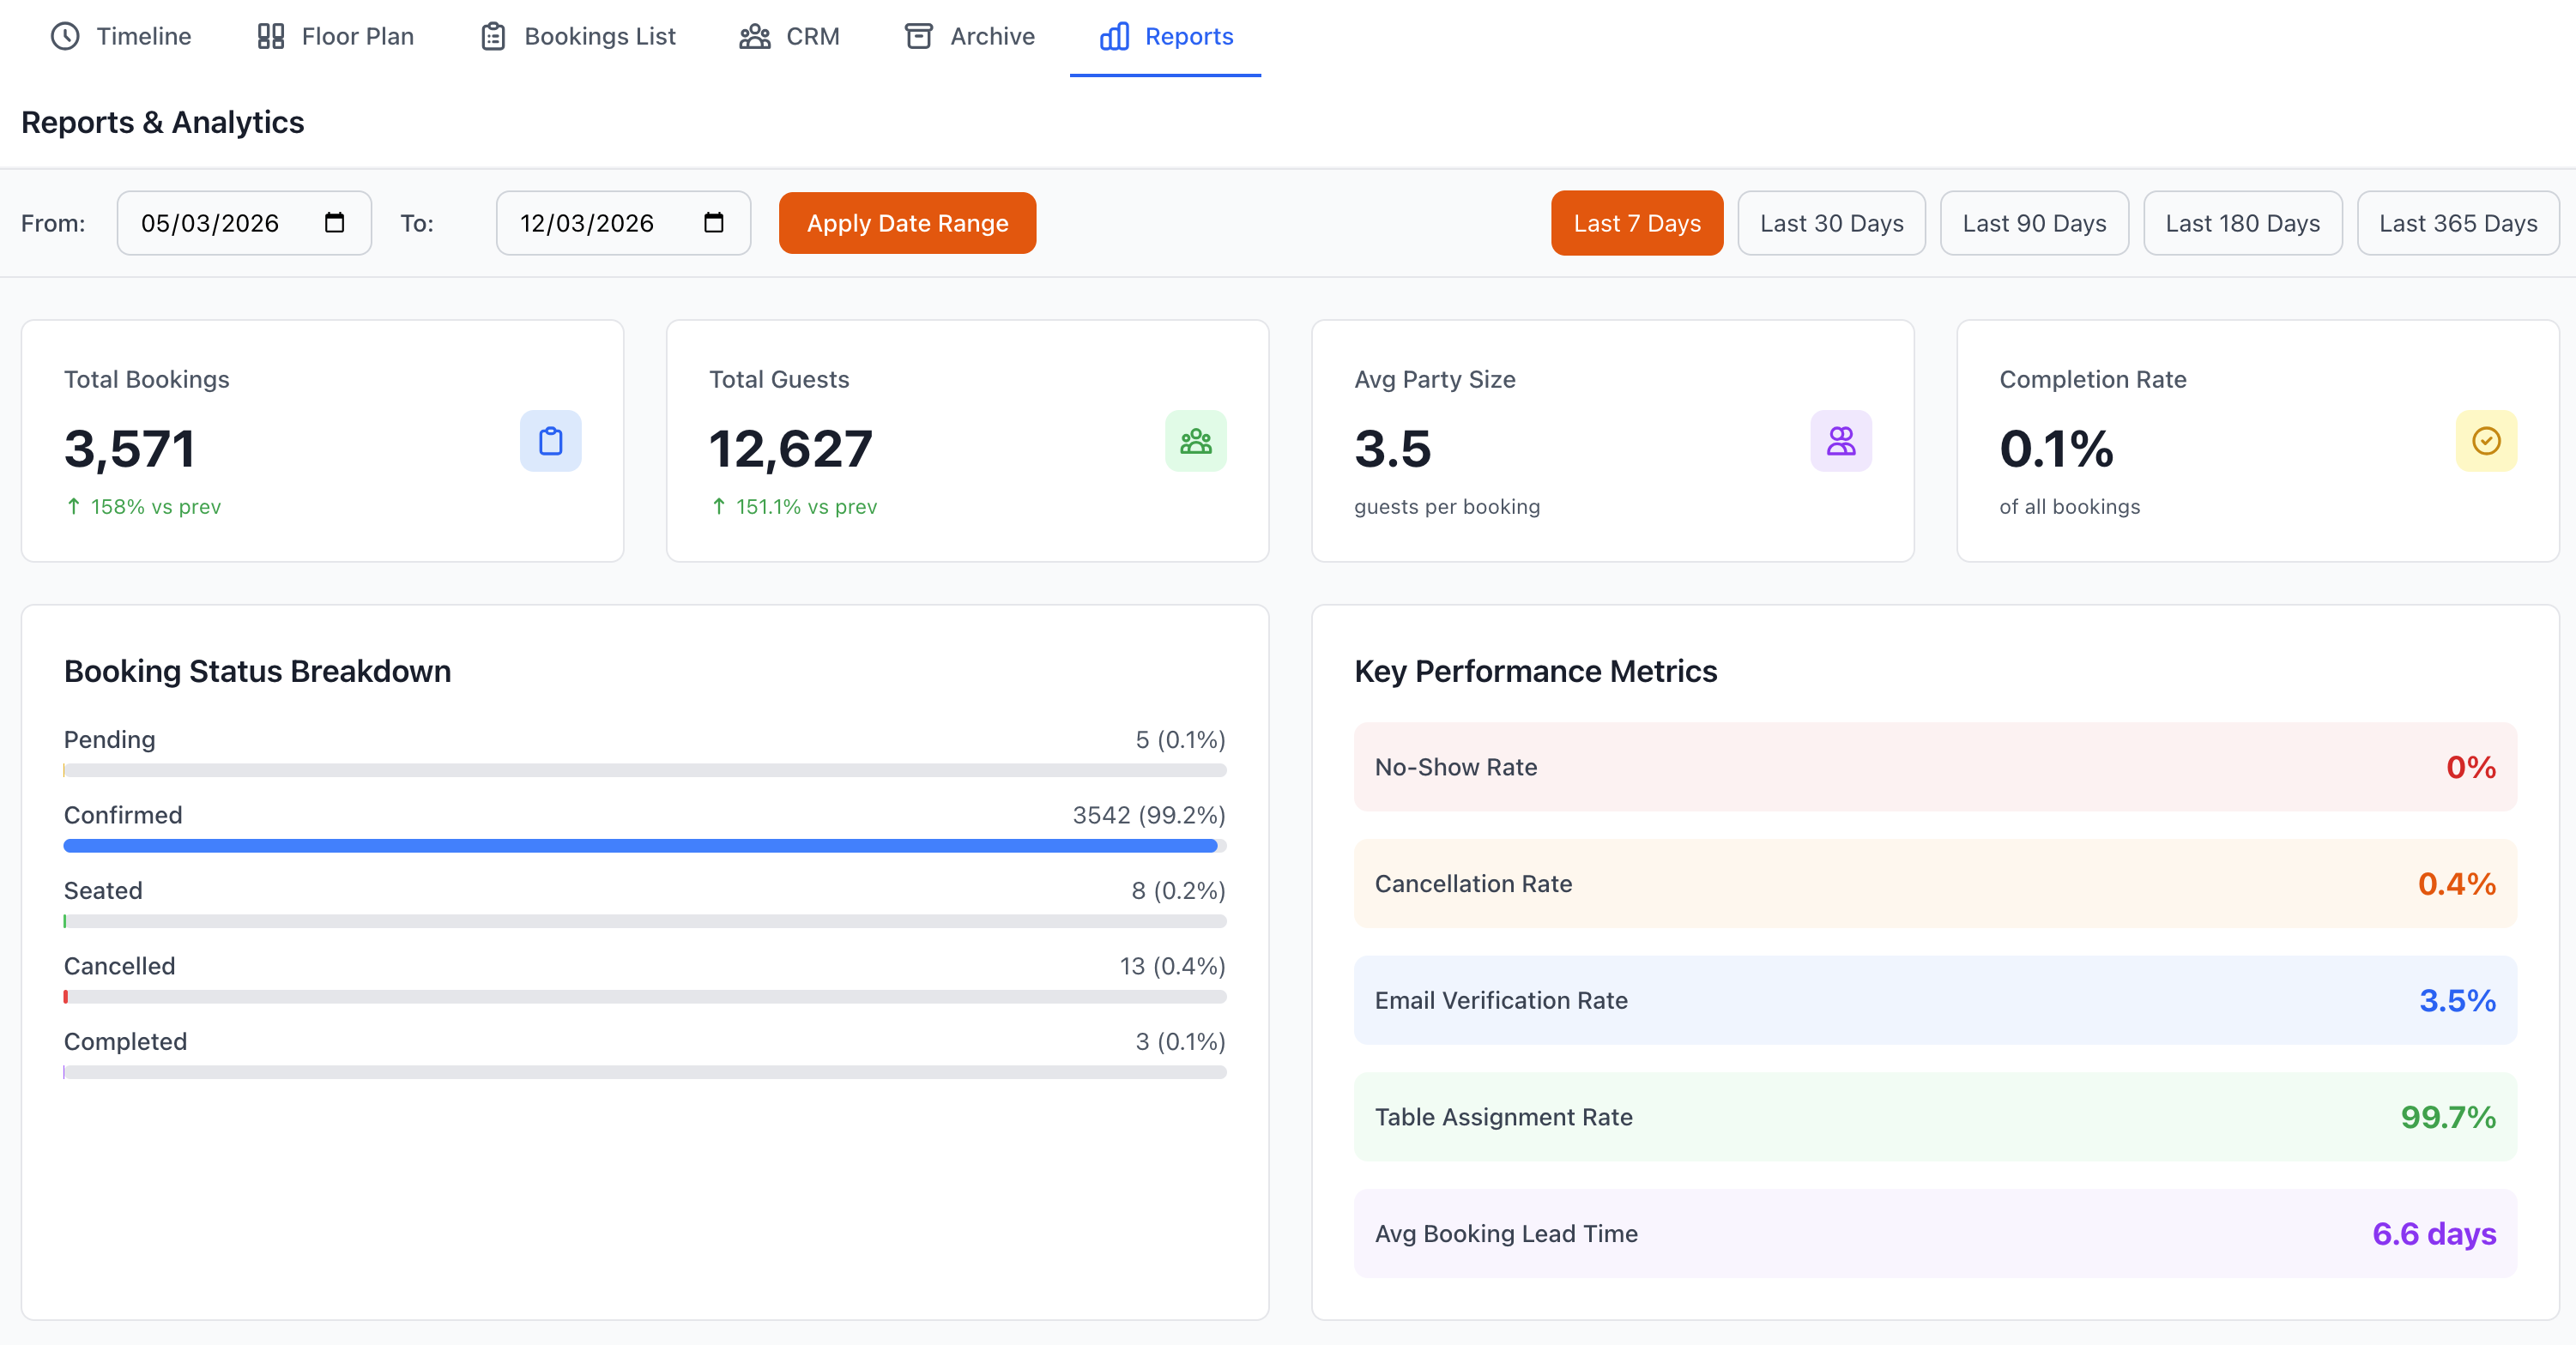
Report Dashboard
Quick Stats
At-a-glance metrics:
Today's Overview
- Total bookings
- Confirmed covers
- Current occupancy
- Expected revenue
- Cancellations
- No-shows
This Week
- Week-to-date bookings
- Revenue trend
- Average party size
- Booking sources
- Comparison to last week
This Month
- Monthly performance
- Revenue vs target
- New customers
- Returning customers
- Growth rate
- Year-over-year
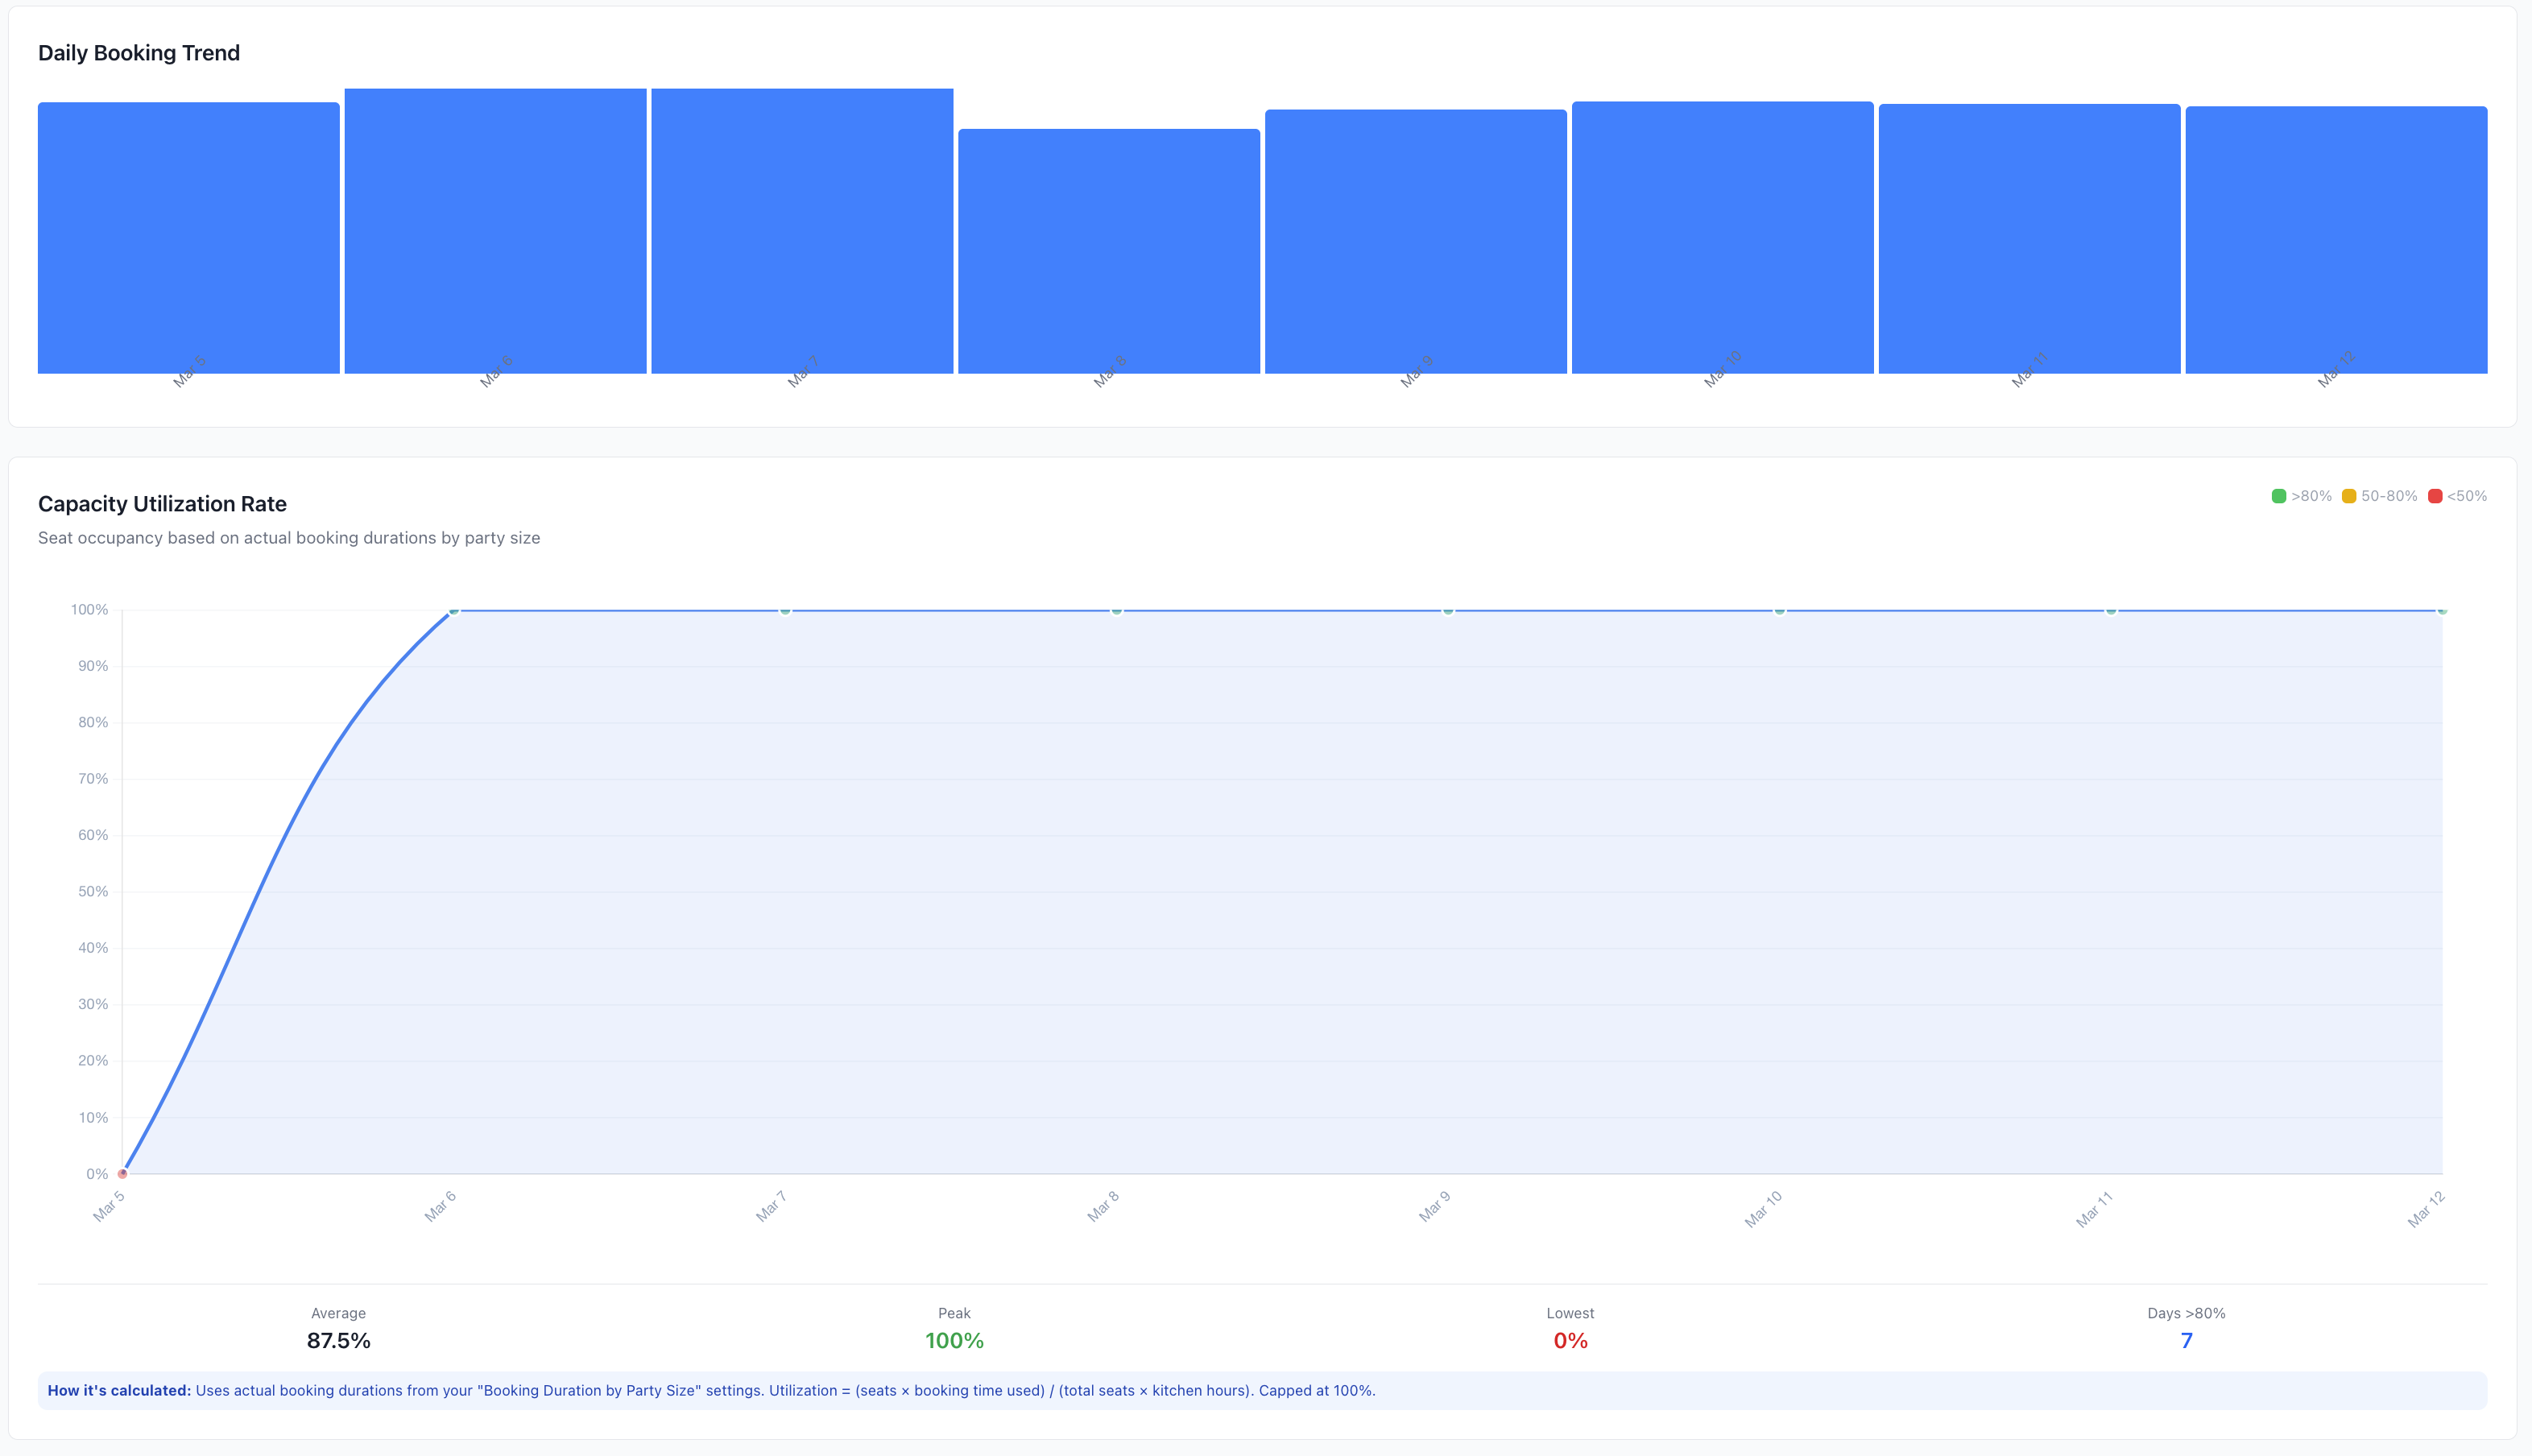
Visual Charts
Dashboard charts:
- Booking volume trends
- Revenue by day/week
- Source distribution
- Service period breakdown
- Customer segments
- Table utilization
- Peak time heatmap
Standard Reports
Booking Reports
Booking Summary
- Total bookings by period
- By status (confirmed, cancelled, etc.)
- By source (online, phone, etc.)
- By service period
- Average party size
- Booking lead time
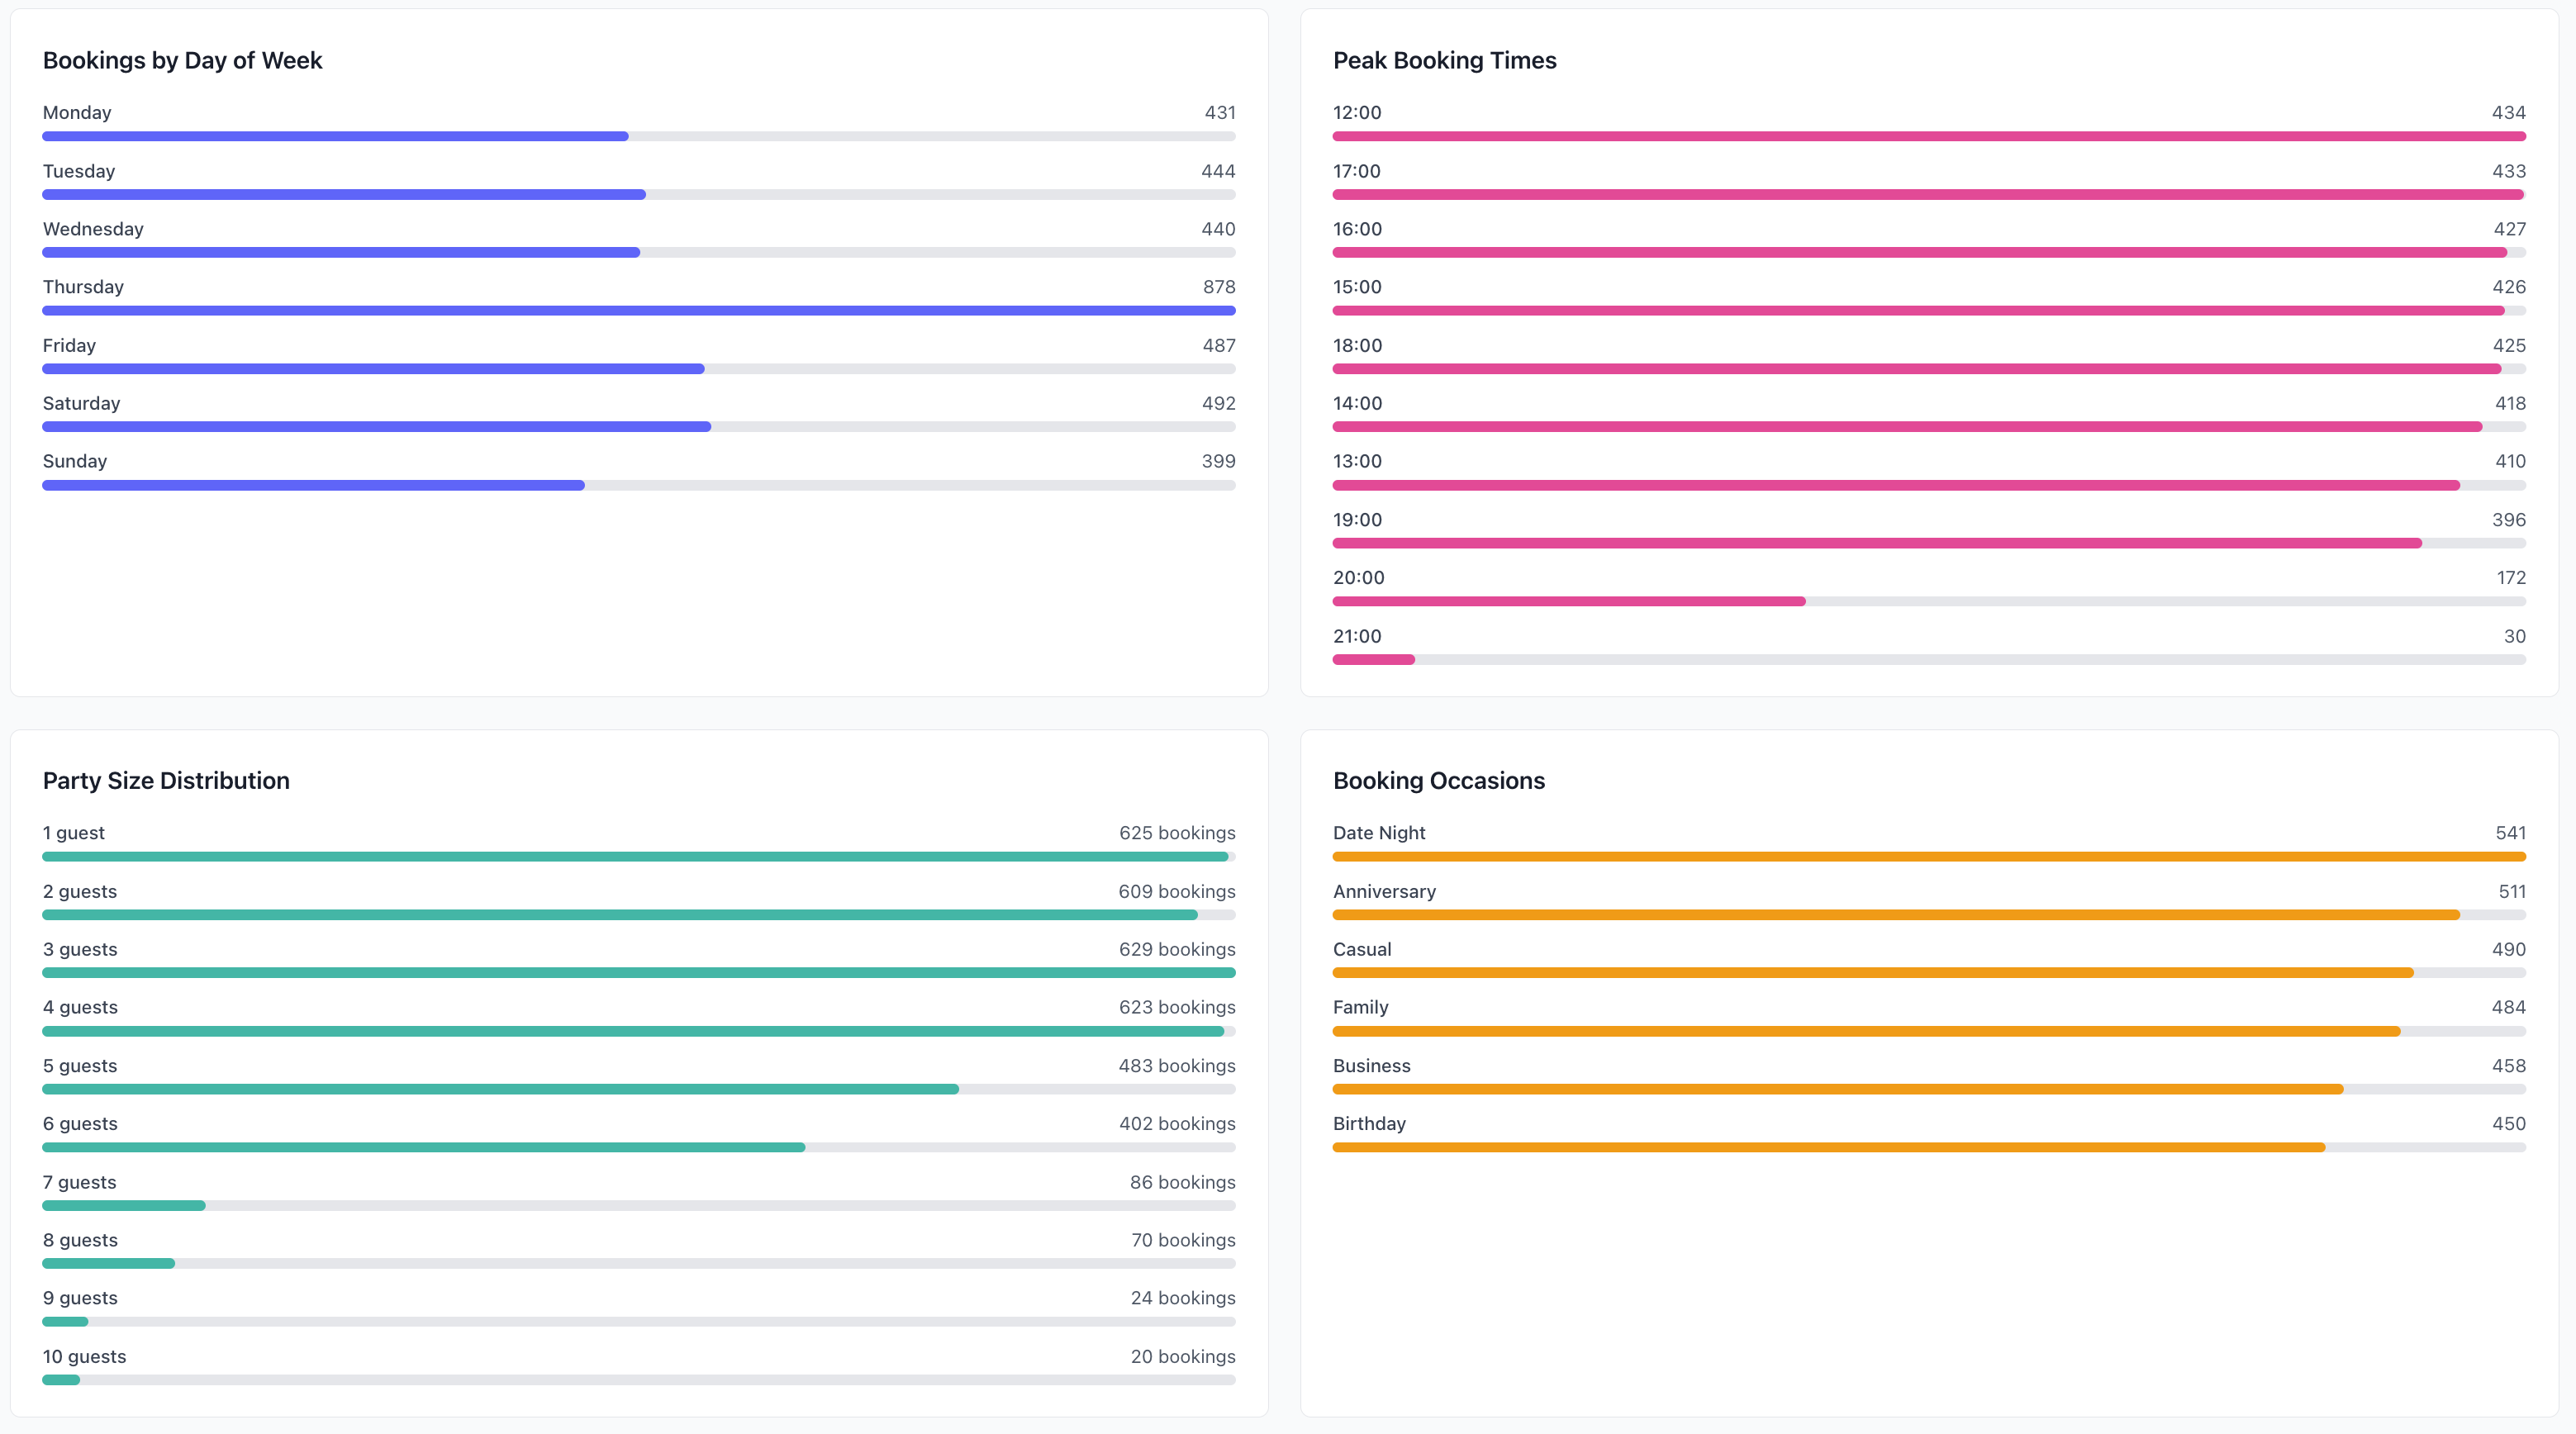
Booking Trends
- Daily/weekly/monthly patterns
- Day of week analysis
- Time of day distribution
- Seasonal patterns
- Growth trends
- Forecasting
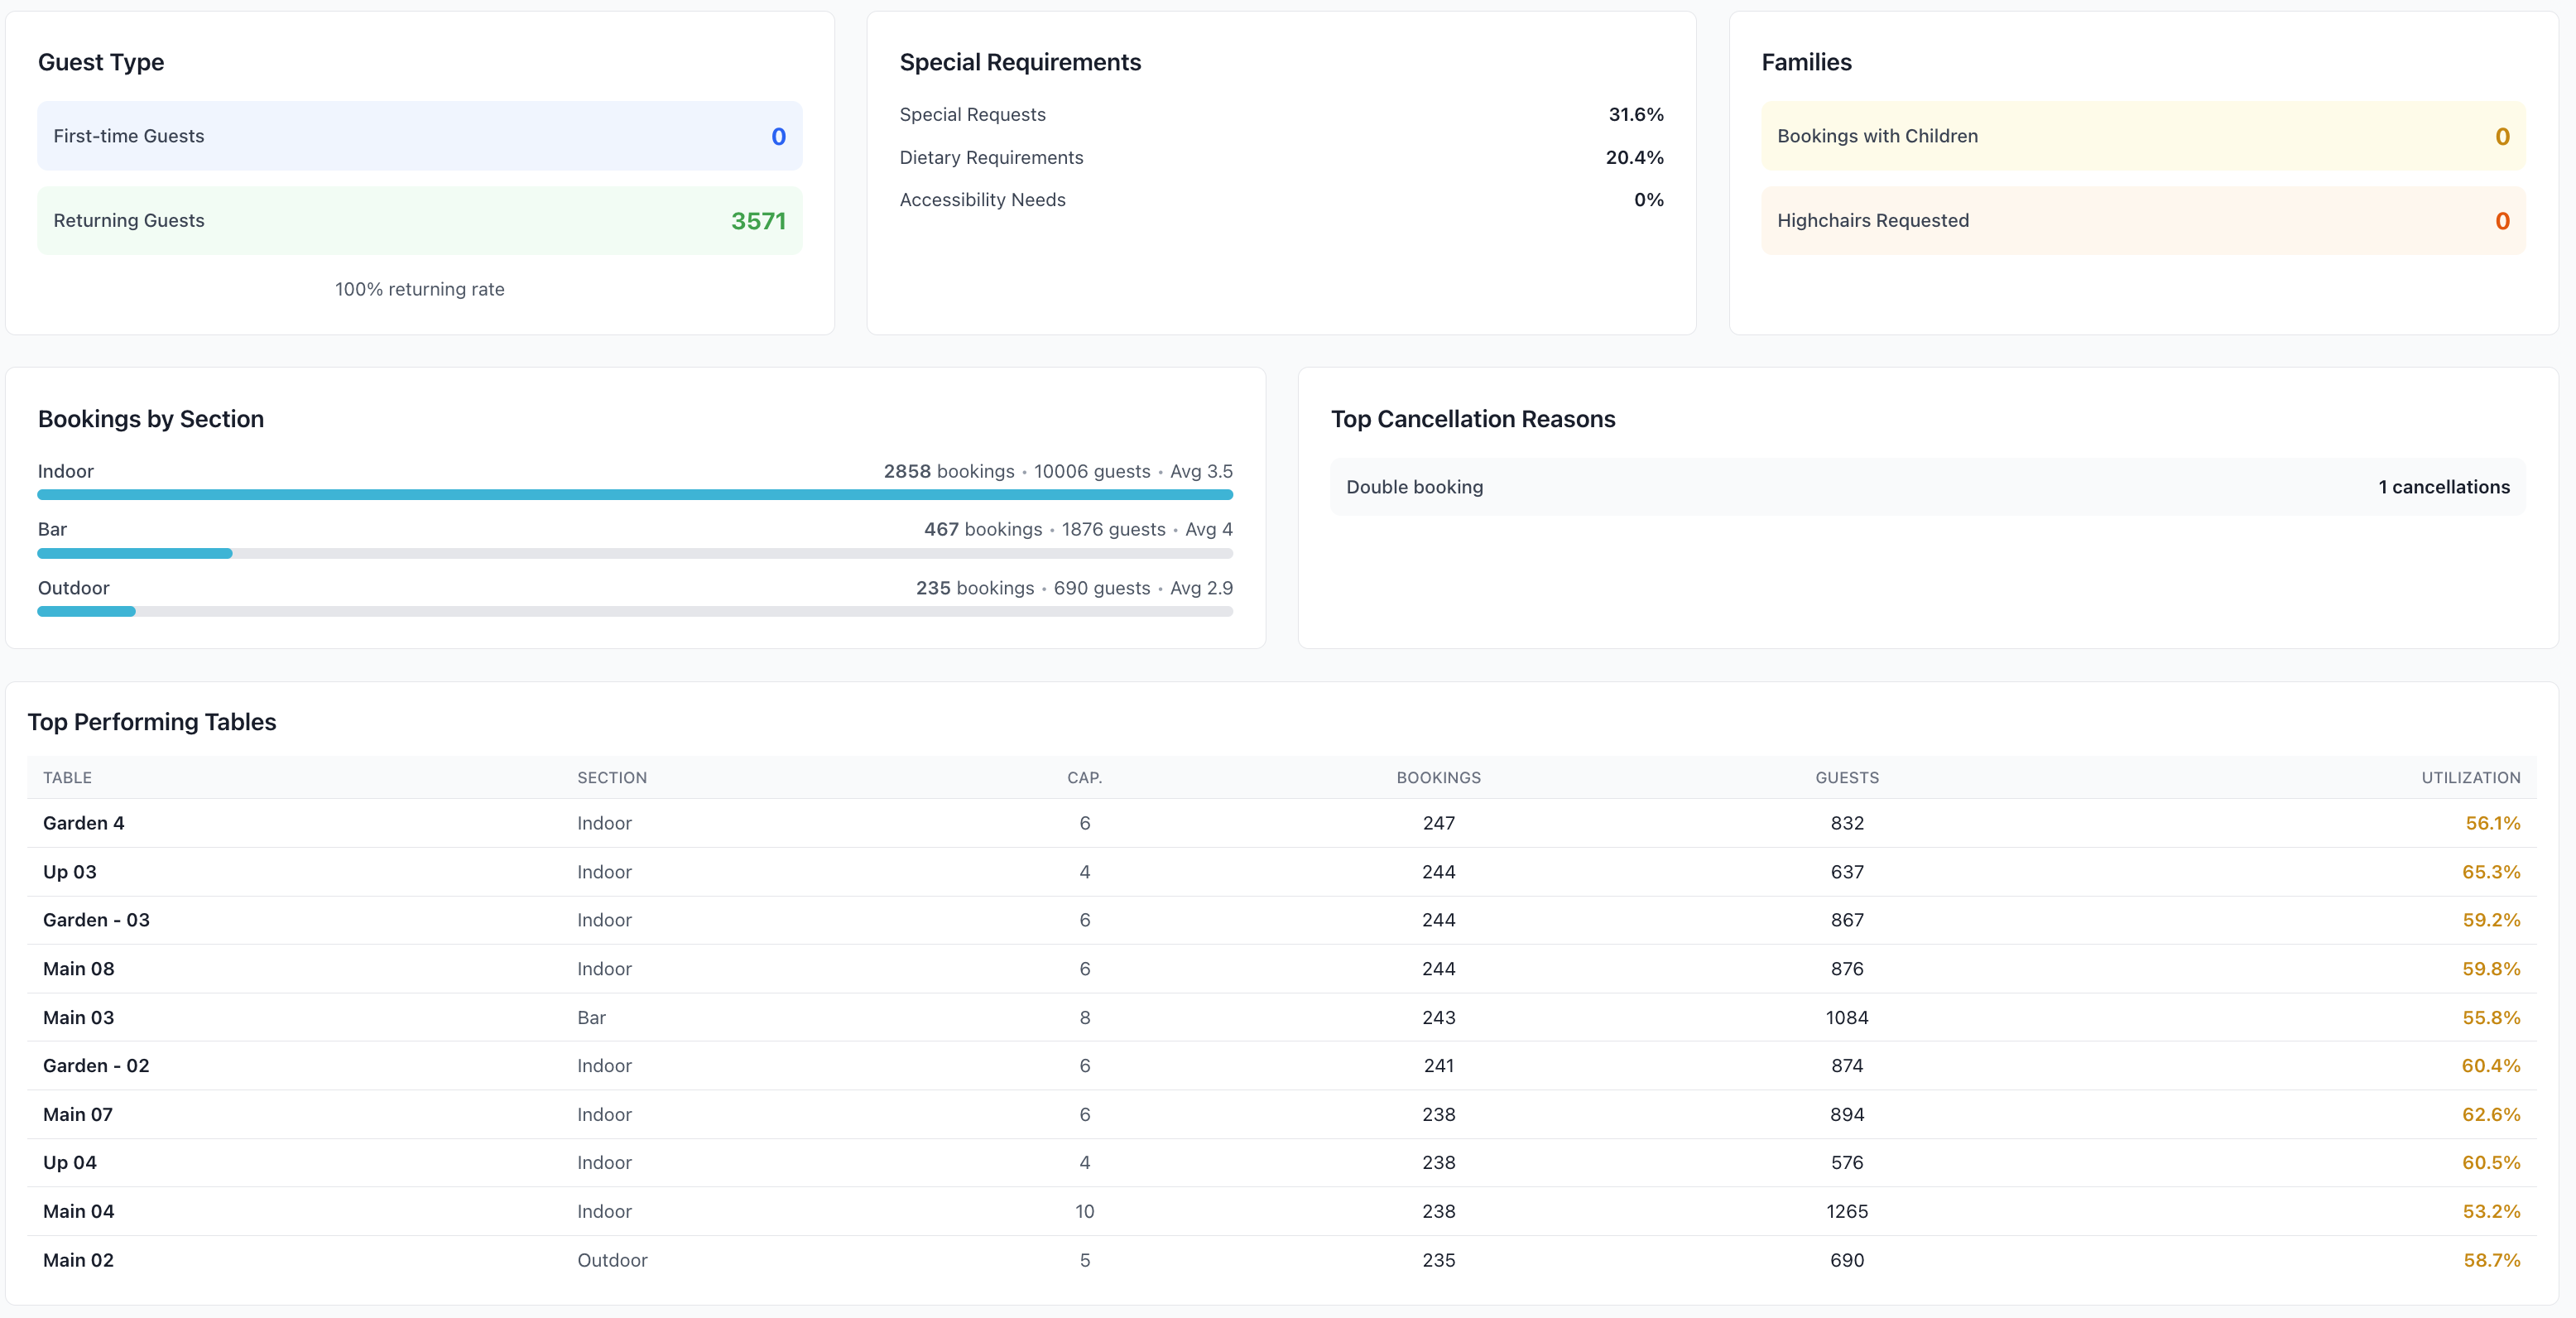
Table Utilization
- Table occupancy rates
- Turn times by table
- Most/least used tables
- Area performance
- Capacity analysis
- Optimization opportunities
Revenue Reports
Revenue Summary
- Total revenue by period
- Average revenue per booking
- Revenue by source
- Revenue by service
- Revenue by table
- Deposit tracking
Revenue Analysis
- Revenue trends
- Growth rates
- Forecast vs actual
- Budget performance
- Profit margins
- revenue optimization
Payment Reports
- Payment methods
- Deposit collected
- Outstanding balances
- Refunds issued
- Payment trends
- Transaction history
Customer Reports
Customer Overview
- Total customers
- New customers
- Returning customers
- Customer retention rate
- Lifetime value
- Acquisition cost
Customer Segmentation
- VIP customers
- Frequency distribution
- Spend distribution
- Geographic distribution
- Demographics
- Behavior patterns
Customer Lifetime Value
- Total visits
- Total spend
- Average visit value
- Visit frequency
- Projected value
- Retention probability
Operational Reports
No-Show Analysis
- No-show rate
- No-show patterns
- By time/day
- By customer segment
- Cost impact
- Prevention effectiveness
Cancellation Analysis
- Cancellation rate
- Cancellation reasons
- Timing analysis (how far in advance)
- By customer segment
- Revenue impact
- Policy effectiveness
Service Performance
- Service speed
- Table turn times
- Wait times
- Staff efficiency
- Customer satisfaction
- Operational bottlenecks
Marketing Reports
Source Performance
- Bookings by source
- Conversion rates
- Source value
- Marketing ROI
- Channel effectiveness
- Attribution analysis
Campaign Performance
- Email campaigns
- SMS campaigns
- Special offers
- Event promotions
- Response rates
- Revenue generated
Review & Feedback
- Review scores
- Review volume
- Sentiment analysis
- Common themes
- Response rates
- Improvement trends
Custom Reports
Report Builder
Create custom reports:
1. Select Report Type
- Booking analysis
- Revenue analysis
- Customer analysis
- Operational analysis
- Custom metrics
2. Choose Date Range
- Today/Week/Month/Year
- Custom start and end
- Comparison periods
- Rolling periods
- Fiscal periods
3. Select Metrics
- Choose data points
- Calculations
- Aggregations
- Formulas
- Comparisons
4. Apply Filters
- Venue
- Service period
- Booking source
- Customer segment
- Table area
- Status
- Tags
- Custom criteria
5. Group & Sort
- Group by dimensions
- Sort order
- Subtotals
- Grand totals
- Hierarchical grouping
6. Visualize
- Table format
- Charts
- Graphs
- Heatmaps
- Dashboards
7. Save & Schedule
- Name report
- Save template
- Schedule delivery
- Email recipients
- Export format
Report Scheduling
Automated Reports
Schedule regular delivery:
Frequency Options
- Daily
- Weekly
- Monthly
- Quarterly
- Custom schedule
Delivery Settings
- Email recipients
- File format
- Include charts
- Attached or link
- Time of delivery
Common Schedules
- Daily sales report (end of day)
- Weekly performance (Monday morning)
- Monthly summary (1st of month)
- Financial reports (monthly/quarterly)
- Executive dashboard (weekly)
Exporting Reports
Export Formats
File Types
- Excel (.xlsx)
- PDF (formatted)
- CSV (data only)
- PowerPoint (.pptx)
- Google Sheets
- Image (PNG/JPG)
Export Options
- Click Export
- Choose format
- Select options:
- Include charts
- Include raw data
- Page layout
- Formatting
- Download file
Sharing Reports
Distribution Methods
- Email directly
- Download and share
- Scheduled delivery
- Shared links
- Dashboard access
- API export
Comparative Analysis
Period Comparison
Compare timeframes:
Common Comparisons
- This week vs last week
- This month vs last month
- This year vs last year
- Same day last week
- Same month last year
- Quarter over quarter
Metrics Compared
- Booking volume (count & %)
- Revenue (amount & growth)
- Average values
- Customer counts
- Performance indicators
- Trends
Venue Comparison
Multi-venue operations:
Compare Across Venues
- Performance metrics
- Revenue comparison
- Booking volumes
- Customer satisfaction
- Operational efficiency
- Best practices
Identify
- Top performers
- Underperformers
- Best practices
- Areas for improvement
- Resource allocation
- Investment priorities
Key Performance Indicators
KPI Dashboard
Track critical metrics:
Booking KPIs
- Booking conversion rate
- Average party size
- Booking lead time
- Online booking %
- Confirmation rate
Revenue KPIs
- Revenue per available seat hour (RevPASH)
- Average check size
- Covers per service
- Revenue growth
- Target achievement
Customer KPIs
- Customer retention rate
- Customer acquisition cost
- Net Promoter Score (NPS)
- Customer lifetime value
- Repeat visit rate
Operational KPIs
- Table turnover rate
- No-show rate
- Cancellation rate
- Occupancy rate
- Staff efficiency
Target Setting
Set and track goals:
Define Targets
- Revenue goals
- Booking targets
- Customer acquisition
- Retention goals
- Operational targets
Track Progress
- Current vs target
- Trend analysis
- Achievement percentage
- Alerts for off-track
- Action recommendations
Best Practices
Report Strategy
- Regular Reviews - Consistent schedule
- Actionable Insights - Focus on decisions
- Key Metrics - Don't track everything
- Trend Analysis - Look for patterns
- Comparative Data - Context matters
Data Interpretation
- Context - Understand the why
- Multiple Metrics - Holistic view
- Trends Over Time - Not just snapshots
- Segments - Break down data
- Validate - Double-check anomalies
Report Distribution
- Right People - Relevant stakeholders
- Right Frequency - Not too much/little
- Right Format - Easy to consume
- Executive Summary - Key highlights
- Action Items - What to do next
Advanced Analytics
Predictive Analytics
Forecast future performance:
Forecasting
- Demand prediction
- Revenue projection
- Customer behavior
- Seasonal patterns
- Capacity planning
Optimization
- Pricing strategies
- Capacity allocation
- Staff scheduling
- Inventory planning
- Marketing spend
Cohort Analysis
Track customer cohorts:
Cohort Groups
- By acquisition month
- By first visit date
- By customer source
- By spending tier
- Custom cohorts
Metrics Tracked
- Retention rates
- Lifetime value
- Visit frequency
- Spend progression
- Churn prediction
Integration
External Tools
Connect with analytics platforms:
Supported Integrations
- Google Analytics
- Tableau
- Power BI
- Excel/Google Sheets
- Custom BI tools
API Access
- Export via API
- Automated data pulls
- Real-time feeds
- Custom integration
- Developer documentation
Troubleshooting
Report Not Generating
If report fails:
- Check date range valid
- Verify filters correct
- Reduce data volume
- Check permissions
- Clear cache
- Try again
- Contact support
Incorrect Data
If numbers seem wrong:
- Verify date range
- Check filters applied
- Review data source
- Compare with raw data
- Check calculation method
- Validate with other reports
- Report bug if confirmed
Slow Report Generation
Performance issues:
- Narrow date range
- Reduce complexity
- Remove unnecessary metrics
- Run during off-peak
- Export instead of view
- Consider scheduled report
Export Issues
Problems downloading:
- Try different format
- Reduce size
- Check browser settings
- Disable popup blocker
- Try different browser
- Contact support
Support
Need help with Reports?
- Email: [email protected]
- WhatsApp: WhatsApp Support
Related Pages
- Archive - Historical data
- Bookings List - Current bookings
- CRM - Customer analytics
Data-Driven Decisions
Review key reports weekly to identify trends, opportunities, and issues early. Data beats gut feeling every time.